

A customer success QBR example becomes useful when the figures lead to a specific conversation: which goal improved, which gap remains, and who owns the next action. This walkthrough follows one fictional customer account through adoption, workflow performance, support and a next-quarter success plan.
Example disclosure: Meridian Operations, HarborFlow, all figures, targets and dates below are fictional teaching data from the TemplateBase QBR example. They are not customer results or industry benchmarks. The worked calculations illustrate a reporting method; your customer must agree the definitions and goals.
For broader context, Gainsight’s QBR guide describes reviewing agreed goals and closing with responsibilities and timelines. Here we focus on how to prepare evidence for that conversation.
The account and measurement boundary
The fictional customer uses an approval-workflow platform across Operations, Finance and IT. Its contract includes 600 licensed seats. The review covers April through June 2026, with a March baseline. “Weekly active” means a licensed user completed at least one approval action during the final full calendar week of each month.
Write that definition next to the chart. A login count, a completed-action count and a monthly active population answer different questions. Combining them would make a trend hard to interpret. If license scope or tracking changes, explain the change before comparing periods.
1. Calculate adoption from the underlying counts
At June close, the three teams have the following fictional counts. Each licensed user belongs to one team, and each active count uses the same observation window.
| Team | Licensed seats | Active users | Adoption |
|---|---|---|---|
| Operations | 300 | 195 | 65.0% |
| Finance | 180 | 144 | 80.0% |
| IT | 120 | 81 | 67.5% |
| Total | 600 | 420 | 70.0% |
Total adoption = total active users ÷ total licensed seats = 420 ÷ 600 = 70%. Averaging the three team rates gives about 70.8%, which overstates this account’s result because the team sizes differ. Keep counts with the percentages so the total remains auditable.
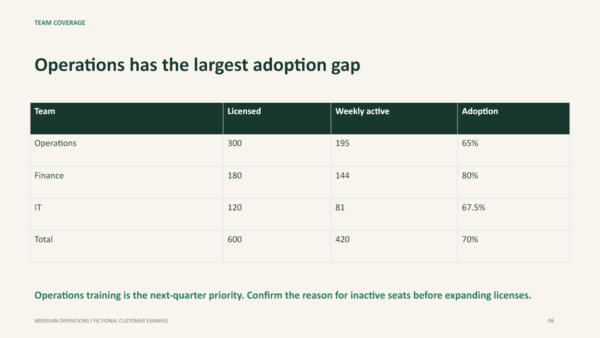
The March baseline was 360 active users out of the same 600 seats, or 60%. June adoption therefore increased by 10 percentage points. The customer-agreed target in this example is 75%, so the remaining gap is five percentage points. At a fixed 600-seat denominator, 75% represents 450 active users: 30 more than June’s 420.
That gap supports an investigation and an agreed action. Ask the Operations champion which workflows or permissions explain inactive seats. A usage gap alone does not establish dissatisfaction or justify more licenses. Confirm whether the target and denominator should carry into the next quarter.
2. Separate an observed outcome from an unverified benefit
The example’s median approval time falls from 48 elapsed hours at baseline to 30 hours in June. The June median comes from 240 completed requests. The descriptive change is 18 hours, or (48 − 30) ÷ 48 = 37.5% of the baseline.
A defensible review statement is: “Median elapsed approval time fell from 48 to 30 hours for the measured completed-request cohort.” Keep the request types, clock rule and sample size visible. Calendar hours and business hours are different measures, and open requests can reveal delays that a completed-only cohort misses.
This calculation does not establish employee hours saved or financial ROI. Elapsed time includes waiting, and a difference between medians is not a sum of individual time savings. Multiplying that difference by the request count would not validate a labor-saving claim. Other process changes may also have contributed. Any financial-benefit claim needs a separate method and customer-approved evidence.
The preparation workbook accepts the two externally calculated medians and the current sample count. It calculates their difference and relative change. It does not calculate a median from request records or combine team medians into an account median.
3. Reconcile support and rollout before writing the narrative
For support tickets, the example starts the quarter with eight open tickets, creates 40 and resolves 43. The reconciliation is 8 + 40 − 43 = 5 closing tickets. Compare that result with the independently reported closing queue.
If your queue treats reopened or reclassified tickets as additional movements, use a source reconciliation that captures them. Do not force a difference into “resolved” simply to make the numbers balance. Two of the example’s five open tickets affect export reliability; those two are a subset of the closing total.
Configured workflow coverage separately moves from 12 to 16 of a fixed 20-process inventory. Current coverage is 80%, with four processes remaining. “Configured” means a standard workflow has an assigned owner in this example. It does not mean every employee uses that workflow, and it does not replace the adoption measure.
4. Turn the QBR into an owned success plan
The meeting leaves two unresolved conditions: the customer needs an executive sponsor, and the export issue needs acceptance evidence. These are discussion conditions, not churn predictions. A useful next step names an accountable role, a due date and an observable completion criterion.
| Action | Accountable owner | Due | Completion evidence |
|---|---|---|---|
| Export acceptance check | Vendor Support with customer IT | 10 July 2026 | Customer approves the test output |
| Confirm executive sponsor | Customer leadership | 17 July 2026 | Named owner accepts the success plan |
| Operations adoption session | Customer champion | 31 July 2026 | Attendance and a later active-user check |
Gainsight’s Success Plan overview describes tracking objectives and tasks for customer goals. The table above is our own simplified fictional example of that workflow, with evidence fields added for review.
For a reproducible follow-up snapshot, enter the review date explicitly. On 15 July, an unfinished export check due 10 July is overdue. A sponsor confirmation due 17 July remains open. If the export check was completed on 14 July and has accepted output recorded, it can be marked complete. A “Completed” label without evidence or a valid completion date still needs review.
The included tracker compares real date-only cells against a manual review date. It flags partial records, hidden time values, missing owners and inconsistent completion fields. It has no automated reminders or CRM connection. A completed decision-preparation row also does not grant contractual authority.
A preparation checklist for your next customer review
- Confirm the customer’s goal, target direction and decision needed.
- Record the review period, activity event, cut-off and population.
- Reconcile team counts and calculate total adoption from totals.
- Check comparable request types and the limits of completed-only medians.
- Reconcile support movements to the independently reported closing queue.
- Keep workflow configuration separate from active usage.
- Assign an owner, due date and acceptance evidence to each next step.
- Ask the customer to review the record before wider circulation.
Frequently asked questions
What should a customer success QBR include?
For this example, the review includes agreed goals, scoped adoption and outcome evidence, unresolved conditions, a success plan and customer decisions. Adapt the scope to what the customer needs to discuss. A fixed slide count is not proof of a useful meeting.
Is product adoption proof of customer value?
Adoption describes the defined activity population. Discuss it alongside the customer’s outcome measures and limitations. It does not independently prove ROI, satisfaction or renewal intent.
Can I use a board update deck for a customer QBR?
Check audience and confidentiality first. A company board update covers company performance and director decisions. This QBR concerns one customer’s goals and actions. Our SaaS board update checklist covers the other use case.
Does the TemplateBase kit update slides automatically?
No. The workbook prepares metrics and tracks follow-up. Transfer values into native PowerPoint charts, tables and narrative manually, then reconcile the finished slides.
Use the worked example and start your own review
The Customer Success QBR PowerPoint Template includes the complete 16-slide fictional example, a matching 16-slide working template and a two-sheet Excel preparation and follow-up tool. The working charts contain clearly labeled zero placeholders that must be replaced. Review the actual previews and file requirements before buying.
The kit helps structure preparation and follow-up. Customer-approved evidence and your normal reporting and commercial review remain necessary.