


SaaS board update PowerPoint template for a clear quarterly review
The SaaS Board Update PowerPoint Template pairs a complete 15-slide fictional report with a matching 15-slide working deck and an Excel data-preparation workbook for founders, finance leads and operating teams. A fictional B2B SaaS company connects the growth narrative to retention, operating results, cash, sales conversion and a specific board decision. The example figures reconcile across the deck, so you can see how a finished report works before replacing the data with your own.
Prepare your board update before choosing a template
Start with the data and decisions, then choose the slide framework. These free resources help you check the inputs before buying or editing this deck.
- Free SaaS board update PowerPoint sample and checklist — try a six-slide editable sample, then use the 16 preparation checks. No checkout or email signup required.
- SaaS board update guide with a worked fictional example — reconcile an ARR bridge, separate new sales from retention and frame a decision request.
The free six-slide sample covers an ARR example and preparation pages. The paid kit adds the full operating report, a matching working deck and the Excel preparation tool. Charts and tables are updated manually.
What is included
- Two 15-slide PPTX files in widescreen 16:9: a complete fictional example and a matching working template with bracketed fields.
- Four native PowerPoint charts per deck for ARR, cash, sales funnel and activation. The working charts use clearly labeled zero placeholders that you must replace through Edit Data.
- Six native tables per deck covering ARR movements, retained customers, operating results, renewal risks, forecast cases and metric definitions.
- Speaker notes on every slide with definitions, reconciliation checks or editing guidance.
- A three-sheet Excel data-preparation workbook: Metrics calculates ARR reconciliation, cohort retention, gross margin, operating result, simple runway and funnel rates; Chart data collects trend inputs and calculates activation rates; Evidence records sources, owners, definitions and decision preparation.
- A README, a data-to-slide setup guide with worked inputs, and a single-business use license.
Version 1.1: the working deck and Excel preparation tool are included in the same download. Excel does not automatically update PowerPoint, and this is not a connected financial model.
The 15-slide report structure
- Quarterly board update cover.
- Meeting map built around four discussion questions.
- Executive summary with exit ARR, net ARR added, gross margin and runway.
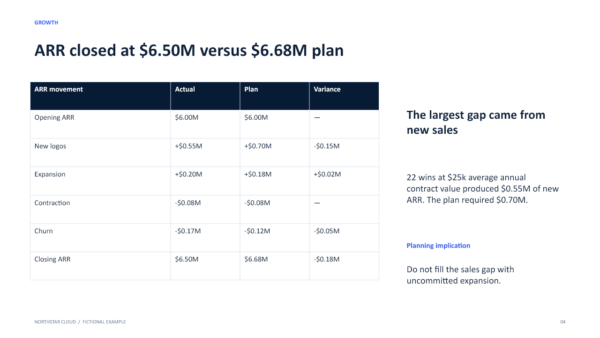
- Actual versus plan ARR bridge.
- Six-month ARR trend.
- Opening-customer retention bridge.
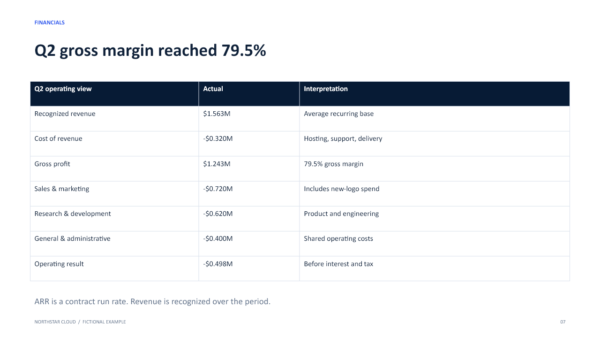
- Quarterly operating view and gross margin.
- Cash balance and current-burn runway.
- Sales funnel with stage conversion.
- Product activation with an explicit event definition.
- Renewal risk themes and owned actions.
- Downside, base and upside ARR cases.
- Risks that could change the outlook.
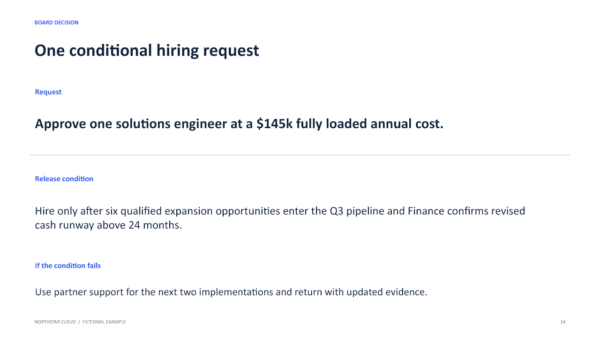
- Conditional hiring request for a board decision.
- Definitions and source checks.
Why the example is useful
The example starts Q2 at $6.00M ARR and ends at $6.50M after new logos, expansion, contraction and churn. The retained opening cohort separately ends at $5.95M, keeping new sales out of retention. Twenty-two fictional new customers at $25k average annual contract value explain the $0.55M new-logo ARR figure. The forecast cases also reconcile from the same opening balance.
These connected examples help you adapt the report without mixing ARR with recognized revenue or treating a simple runway ratio as a forecast. All company names, numbers and situations are fictional. Replace and independently verify every example before presenting it as your company performance.
How to customize the SaaS board update
- Read the example, then save copies of the working deck and Excel workbook. Enter your company, reporting period, currency and amount scale.
- Prepare verified inputs in Excel. Missing inputs show ENTER DATA; invalid inputs show REVIEW INPUTS; an ARR balance difference shows RECONCILE. These arithmetic checks do not verify source accuracy.
- Transfer the checked figures manually. Use PowerPoint Edit Data to replace every chart placeholder, category, unit and axis bound; update the native tables, headline figures and commentary together.
- Read the speaker notes to check metric definitions, periods and reconciliations.
- Replace the sample decision with your actual request, owner, budget and release condition.
- Remove bracketed fields, working notices and blue chart instructions only after you have completed and reviewed every slide.
The deck uses a navy, white and blue visual system with editable foreground text. The abstract cover background is an image. Charts and tables are separate native slide objects. Microsoft PowerPoint and Excel are the intended editors; other apps may require layout adjustments. The workbook uses signed negative ARR losses and positive operating costs. Read the included transfer guide before copying amounts to the slides.
Who this template is for
Early-stage and growing B2B SaaS teams preparing a quarterly board meeting, an operating review or a structured investor update. It works best when you already have reliable billing, CRM and accounting data and want a consistent presentation framework.
Frequently asked questions
Does the deck connect to my systems automatically?
No. The files do not connect to a CRM, billing service or accounting system. The separate Excel workbook does not automatically populate the presentation.
Can I edit the charts and tables?
Yes. Each deck has four charts with embedded editable data and six native PowerPoint tables. The working charts start with visibly labeled zero placeholders, not actual results. Replace all of them before presenting.
Does it include a blank version?
Yes. Version 1.1 includes a separate 15-slide working deck with bracketed text and table fields, plus labeled placeholder charts. The complete fictional example is included separately.
What does the Excel workbook calculate?
It supports ARR bridge reconciliation, opening-cohort GRR and NRR, total ARR growth, gross profit and margin, operating result, simple constant-burn runway, sales stage rates, renewal risk share and activation rates. It also provides chart-input grids and a source/decision register. It does not produce a cash forecast or scenario model, and it cannot verify missing source records or cohort membership.
Can I use it for client work?
The included single-business license allows your own business operations and client work. It does not allow redistribution or resale of the source template. See our License page for details.
How do I access the files?
Your purchase provides the ZIP download link through your order and WooCommerce order email. Visit Download Help for access guidance.

Reviews
There are no reviews yet.